SignalCAVE Strategy BuilderYou can create strategies without writing single line of Pine Script code!
Do backtesting, set alerts and explore algorithmic trading with using SignalCAVE Strategy Builder on TradingView.
SignalCAVE Strategy Builder for TradingView
SignalCAVE is a tool that help you to create strategies in TradingView. SignalCAVE offers flexible strategy builder panel enabling users to backtest and set alerts with custom conditions (selected indicators and parameters).
CAPABILITIES
You can define rules and conditions for “Long” and “Short” signals.
“Stop Loss” or “Take Profit” functions can be activated with providing percentage values.
“Only Long”, “Only Short” or both “Long and Short” signals can be used at the same time.
Available Indicators
EMA, SMA, WMA, HMA, RSI, MACD, Stochastic, Bollinger Bands, SuperTrend, Parabolic SAR, DMI, ATR, CCI, CMF, ROC, Ichimoku, OHLC Prices
How to Set Strategy Rules?
On SignalCAVE strategy settings screen, there are four types of input groups. You can populate these input boxes based on your strategy.
A: First indicator’s parameter and index value selection area
First Input: First indicator selection.
Second Input: First indicator’s parameter selection. If you want to use default parameters, select “Default Parameters”. If you want to use custom parameters, select “Custom Parameters”. If your selection was custom, then you need to fill “P:A” input boxes to assign your custom parameter.
Third Input: First indicator’s index selection. Default parameter is “0”, If you want to get previous value of indicator/price, you can type positive numbers.
?: Condition and Interval selection area.
You can select “Upper (>), Lower (<), Upper or Equal (>=), Lower or Equal (<=), CrossOver (⬆), CrossUnder (⬇)” conditions and time frame interval for calculation both first (A:) and second (B:) indicator.
B: Second indicator’s parameter and index value selection area
First Input: Second indicator selection.
Second Input: Second indicator’s parameter selection. You may use either default parameters, or custom parameters. If your selection was custom, then you need to fill “P:B” input boxes to assign your custom parameter.
Third Input: Second indicator’s index selection. Default parameter is “0”, If you want to get previous values of indicator/price, you can type positive numbers.
P:A First indicator’s custom parameter settings. If selected indicator has less then four parameters, you can fill unnecessary fields with “0” value.
P:B Second indicator’s custom parameter settings. If selected indicator has less then four parameters, you can fill unnecessary fields with “0” value.
DASHBOARD
After you build the strategy with SignalCAVE, you can see rules and conditions on dashboard with chart view screen.
Hint: By adding multiple times of SignalCAVE strategy on your chart screen, you can build more then one strategy.
STRATEGY TESTER / BACKTEST RESULTS
You can see strategy backtest results from “Strategy Tester” panel.
By changing parameters or strategy rules (strategy optimization), you may get better results. These results does not guarantee a success for future trades.
ALERT SETTINGS
If you want to get notify about your strategy outputs (Long Entry, Long Exit, Short Entry, Short Exit, Stop, Take Profit) you can set an “Alert”.
You can click “Alert” button to create a new alert. Make sure on “Conditions” selection must be “SignalCAVE” strategy.
Paste to “Message” field exactly the text below.
{{strategy.order.alert_message}}
Hint: By setting a single alarm, you can get notifications for all outputs.
Do your alerts modifies when you change the strategy conditions or parameters?
While the strategy got updated, its alerts still use the strategy’s state from the time when we made the alert (TradingView Wiki, 2018b).
This has the advantage that, once we made a script alert, we can change the script’s input options, change chart settings, or remove the script from to the chart. All of that won’t affect our existing alert. That gives a lot of flexibility to keep interacting with the chart and script.
But there’s also a disadvantage: if we do want our script’s alerts to change, we first need to remove the existing alerts. Then we have to create and configure new alerts based on the indicator’s updated code or settings.
Komut dosyalarını "RSI MACD" için ara

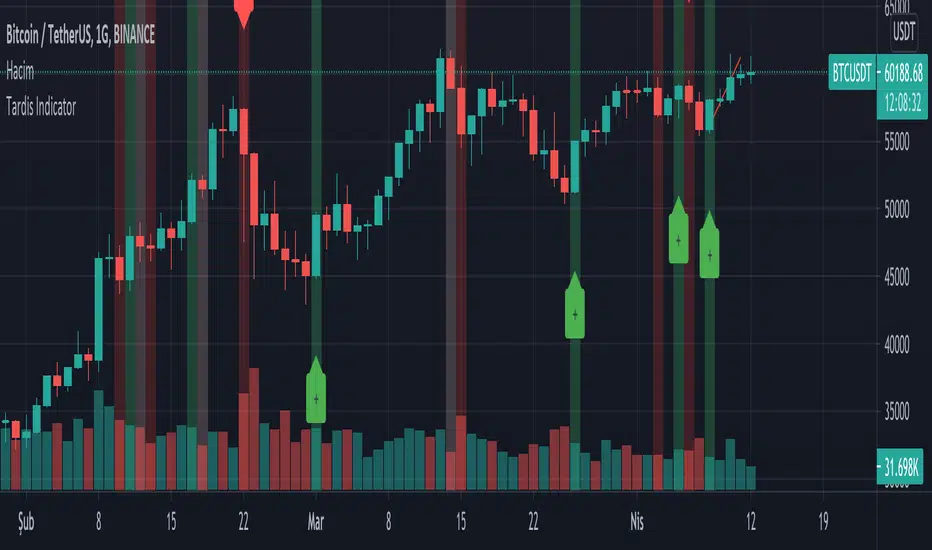
Tardis IndicatorIt allows you to get instant buy and sell signals.
It generates algorithmic signals using indicator rsi , macd , cci , mfi , sma , ema data.
Due to sudden market changes, it works more stably for 4 hours and more.
You can set an alarm for the signals.
Faint colors indicate possibilities. Dark colors are confirmation signals.
Please make your investments by checking on the chart.
Does not contain investment advice!
Please contribute to our development by donating.
Tether USDT Address (ERC20) : 0x869eb3887c1d330bd3fee62d24b181636967ceb6
Tether USDT Address (TRC20) : TJfj6GjPzckB2KHNk7u97mToDxCmhHN534
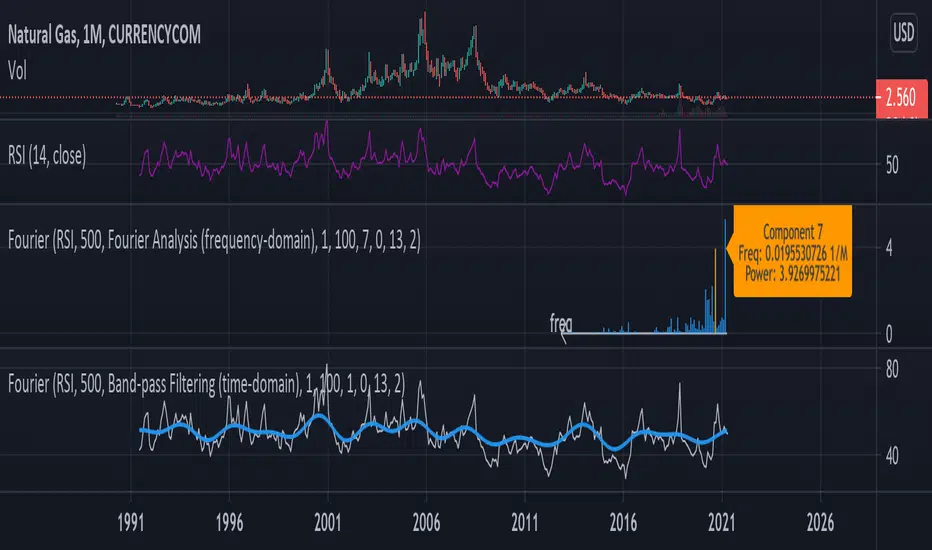
Fourier Analysis and Filtering [tbiktag]This tool uses Fourier transform to decompose the input time series into its periodic constituents and seasonalities , in other words, its frequency components . It also can reconstruct the time-domain data while using only the frequency components within a user-defined range (band-pass filtering). Thereby, this tool can reveal the cyclical characteristics of the studied market.
USAGE
The source and the size of the input data can be chosen by the “ Dataset Source ” and “ Dataset Size ” options. Price, volume, or some technical indicator (e.g., RSI, MACD, etc.) can serve as a source of the input data.
“ Action ” defines the type of the plot that will be displayed. Two options are available:
- Fourier Analysis
If selected, the frequency spectrum of the squares of the Fourier coefficient magnitudes is displayed. The zero-frequency component is on the right. Since the magnitudes of half of the coefficients are repeated, the graph displays only half of the frequency components.
The squared magnitude of a given frequency component is a measure of its power , that is, its contribution to the total variance of the dataset. Thus, by analyzing the frequency-domain spectrum, one can identify the most prominent seasonalities and then visualize them by using the " Band-pass Filtering " option (see below). Note that the zero component stores information about the amount of data, so it is naturally higher when the data is not centered at zero.
By activating the " Info about Frequency Component " option, the user can display information about the power and frequency of the selected Fourier component.
- Band-pass Filter
This option reconstructs and plots the dataset in the time domain, blocking frequency components outside of the cutoff frequencies (defined by the input parameters “ Upper Cutoff ” and “ Lower Cutoff ” input parameters in the “ Band-pass Filter Properties ” section).
FURTHER READING
In general, Fourier analysis has a long history of attempted applications for analyzing price data and estimating market cycles. For example, see the paper by John Ehlers
www.mesasoftware.com
and also some tools available here on TradingView, such as:
“Function: Discrete Fourier Transform” by @RicardoSantos
“Fourier series Model Of The Market” by @e2e4mfck
“Ehlers Discrete Fourier Transform” by @cheatcountry
Thus, I tried to make this tool versatile and user-friendly so you all can experiment with your own analysis.
Enjoy and don't hesitate to leave your feedback in the comments below!
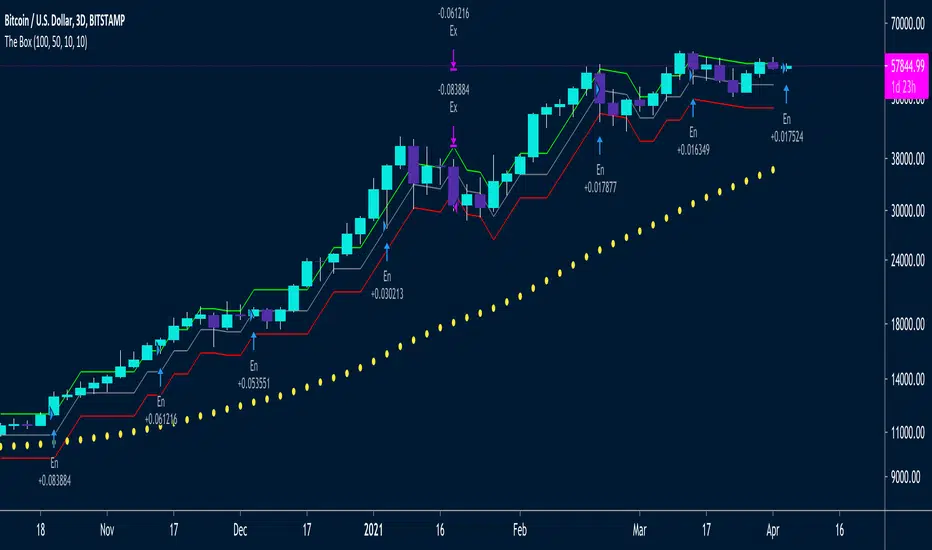
The Box Percent StratHi guys,
Version Zero (more work needed) of an idea I've been meaning to out into a strategy for a while. 🤯
This uses percent boxes🤔 instead of traditional indicators like RSI, MACD etc. 🤫
Takes the first close price of the series and creates a Top Band 10% up, buys if price reaches that level, and puts a stop on a Bot Band, 10% down
When the first trade is in profit by another 10%, it enters another trade and moves the stop of the first trade to breakeven ~ this way it only has one unit of risk at a time
/// Designed for LONG only on Daily, 2D or 3D Charts👌🏻
/// Uses fixed investment risk amount, meaning you're willing to lose that amount per trade
/// Limit buy to not overpay on entries
/// Idea Based on the Darvas system:
/// System only enters trades on strength, when prices equals of exceeds the green line
/// It ads onto the trades, but only *IF* the previous trade is in profit by the UpBoxSize percent size
/// The trailing stop loss is moved up, with the red line
/// A key idea is to only take one unit of risk at a time, meaning for a new add on trade to be taken, the previous trade should be in profit by the same box size as the new new trade's stop loss
/// This will keep adding trades again and again, and they will stop out at the same stop loss
/// Yellow Circles is an MA that filters out choppy areas -- this system only does really well on trending linear markets like: TQQQ, SSO, SPX, SPY
/// Base setting is 10% UpBox Size and 10% DnBox Size: 15% & 15% will be more accurate but fewer signals. 13% profit and 10% stop loss will give a higher risk to reward ratio
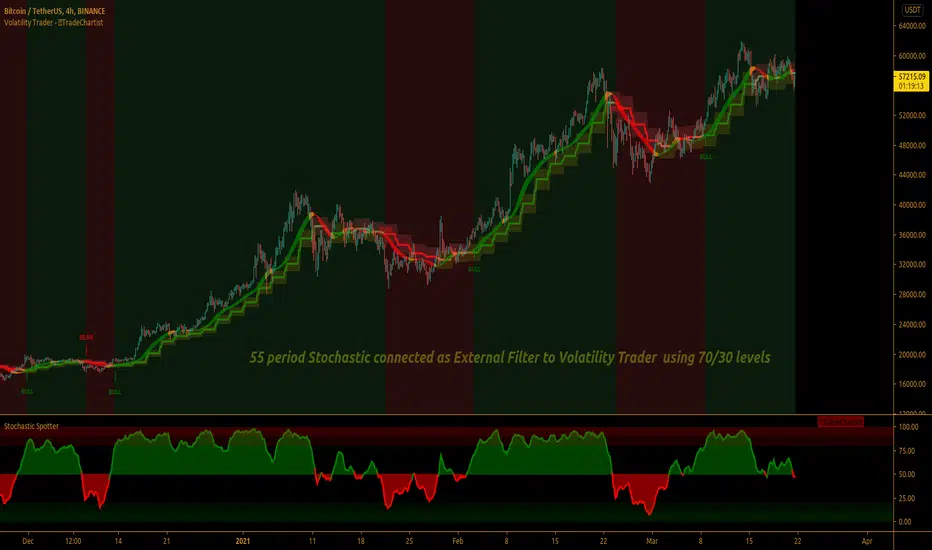
TradeChartist Volatility Trader ™TradeChartist Volatility Trader is a Price Volatility based Trend indicator that uses simple to visualize Volatility steps and a Volatility Ribbon to trade volatility breakouts and price action based on lookback length.
===================================================================================================================
Features of ™TradeChartist Volatility Trader
======================================
The Volatility steps consists of an Upper band, a Lower band and a Mean price line that are used for detecting the breakouts and also used in plotting the Volatility Ribbon based on the price action. The Mean Line is colour coded based on Bull/Bear Volatility and exhaustion based on Price action trend.
In addition to the system of Volatility Steps and Volatility Ribbon, ™TradeChartist Volatility Trader also plots Bull and Bear zones based on high probability volatility breakouts and divides the chart into Bull and Bear trade zones.
Use of External Filter is also possible by connecting an Oscillatory (like RSI, MACD, Stoch or any Oscillator) or a non-Oscillatory (Moving Average, Supertrend, any price scale based plots) Signal to confirm the Bull and Bear Trade zones. When the indicator detects the Volatility breakouts, it also checks if the connected external signal agrees with the trend before generating the Bull/Bear entries and plotting the trade zones.
Alerts can be created for Long and Short entries using Once per bar close .
===================================================================================================================
Note:
Higher the lookback length, higher the Risk/Reward from the trade zones.
This indicator does not repaint , but on the alert creation, a potential repaint warning would appear as the script uses security function. Users need not worry as this is normal on scripts that employs security functions. For trust and confidence using the indicator, users can do bar replay to check the plots/trade entries time stamps to make sure the plots and entries stay in the same place.
™TradeChartist Volatility Trader can be connected to ™TradeChartist Plug and Trade to generate Trade Entries, Targets etc by connecting Volatility Trader's Trend Identifier as Oscillatory Signal to Plug and Trade.
===================================================================================================================
Best Practice: Test with different settings first using Paper Trades before trading with real money
===================================================================================================================
This is not a free to use indicator. Get in touch with me (PM me directly if you would like trial access to test the indicator)
Premium Scripts - Trial access and Information
Trial access offered on all Premium scripts.
PM me directly to request trial access to the scripts or for more information.
===================================================================================================================
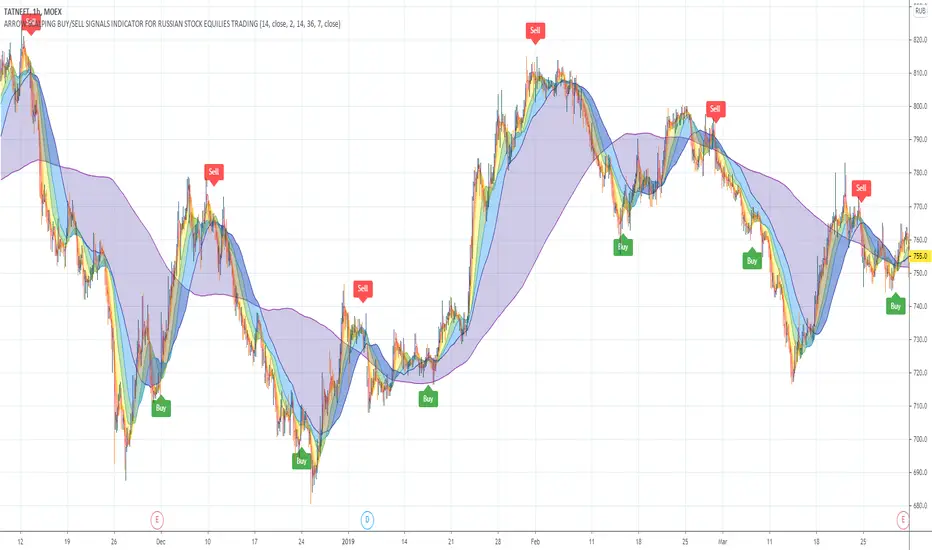
ARROW BUY/SELL INDICATOR FOR TRADING TATNEFT ON MOSCOW EXCHANGEThe arrow buy / sell signals indicator is specially designed for trading on the Moscow Stock Exchange MOEX with shares of commodity and energy companies such as TATNEFT MOEX:TATN .
When developing the indicator, the nature of price movements and the volatility model of TATNEFT shares were taken into account, which made it possible to develop an indicator with refined signals that most effectively predicts the future price movement of shares of energy companies, in particular, TATNEFT MOEX:TATN .
The indicator signals are filtered, and the most accurate signals are reflected on the chart as buy / sell arrows.
The indicator is suitable for intraday trading on the 1H timeframe.
This script indicator can be used as an independent trading system, and can also complement your trading system and increase its performance.
For the development of the indicator, such basic indicators as: Simple Moving Average, RSI, MACD, Bollinger Bands.
The indicator parameters are optimized based on historical data on the price movement of energy companies' stocks, in particular TATNEFT MOEX:TATN using testing.
MA Cloud with FillMA Cloud with Fill
This is a powerful custom indicator that uses 3 Moving Averages with a 4th Constant 200 MA (can be customized)
This tells you what the market is doing, and what the overall trend of the market is. A good Swing trade or Day trade indicator.
This indicator works on all markets , it was made and based off of normal candles but heiken ashi works fine, it does not repaint and the recommendations for the indicator is as follows..
Best timeframes to use: 5min, 15min, and 1hr. But any timeframe can be used.
Best settings: the preset settings are what I recommend, depending on trading strategy (I swing trade) you can remove the Buy and Sell labels and just use the strong signal and trend confirmations to make the best trades.
Alternate recommended settings are in the settings tab of the indicator. The slashes represent different settings you can adjust to..
(Example:)
Fast MA: 10/20/30
Mid MA: 12/25/35
Slow MA: 50/60/70
Use 10,12,50 together... use 20,25,60 together... use 30,35,70 together.. etc...
There are multiple labels and reading them correctly takes an experienced eye. This will be updated continuously to filter bad signals or to add strong signals!
Buy and Sell signals are good entry or exit points depending on the overall trend.
These occur when the Fast MA crosses over(BUY) or under(SELL) the Mid MA
They can alert when a trend may reverse or a good take profit point or a good place for a new stop loss if trend continues.
The BEST Buy and Sell Signals are when the...
BUY is in the fill (between fast ma and slow ma) or above fast MA
SELL is in the fill (between fast ma and slow ma) or below the slow MA
Strong Buy and Strong Sell signals are even better but more swing trading entry points
These occur when the Fast MA(lime) crosses over(BUY) and the close is over the Fast MA or under(SELL) the Slow MA and close is under the Slow MA
These Strong labels are showing a trend change in the market for the timeframe you are looking at.
The General Bullish and Bearish signals are some of the best signals and show a confirmed trend in the market. These can be effective to trade on alone, otherwise good for confirming a position.
These occur when the Fast MA crosses over (BULLISH) the constant MA (200) or under (BEARISH) the constant MA (200)
The Strong Bullish and Bearish signals are the strongest signals for this indicator.
These occur when the Fast MA crosses over (BULLISH) the constant MA (200) and the close is over the Fast MA or under (BEARISH) the constant MA (200) and the close is under the Slow MA.
Background colors of aqua and red are showing the same general bullish or bearish signals, and can be effective if you want to see that trend change without having the labels showing up.
There are settings available to color the bars depending on the trend.
Green if Fast MA is over the Slow MA and the close is above the Fast MA
Red if the Slow MA is over the FAST MA and the close is under the Slow MA
Gray is when the close is opposite of the trend and between the fill
Purple is when the close is opposite of the trend and is Below the opposite corresponding MA (Above Fast MA when bearish, Below Slow MA when Bullish)
You can also change the fill color between the Fast and Slow MA which colors the fill the same as bar colors but the purple will be a light shade of black in the fill.
There are also Pivot Labels and Alternative Tops and Bottoms signals which are betting opposite of the indicators and can be useful for daytrades to see potential reversals. These are very risky and not recommended to trade on .
These are more for seeing if your trend is holding strong or if there could be a potential reversal in the next few bars if you are looking to exit.
Updates are always being made and I'm betting some of you will be able to find even better stronger settings to put in. The recommended settings are just what I personally have noticed that works best, but all inputs can be customized!
Safe Trading Strategy:
Go to settings and uncheck the buy and sell signals.
(up to you) uncheck the strong buy and strong sell signals.
You will be left with the bullish and bearish signals of both general and strong and these have proven to be some of the strongest trades to take.
If you keep the strong buy and strong sell, these can be good to enter a new position or exit a previous position, depending if bullish or bearish trend confirms but some of these can be false overall trend signals and I do recommend using a different indicator to confirm the reversal or confirmation (RSI, MacD, etc..)
Want to use this indicator or wondering how to add to your chart? DM me or join the link in my profile to get a glimpse at what is all available!
We are all in this together and the more one gains, the more we all succeed!

VWAP OscillatorToday I'm proposing a simple VWAP oscillator script to trade buy and sell waves more easily.
You trade this similar to how you trade Awesome Oscillator, so if you want an explanation just look up YT videos.
In addition to that, this will also show volume squeezes, please note that this is a makeshift way and not real volume squeeze phenomena of volume profile and tape. None the less, it is quite good at allowing you to ride out good trending waves and locate weak price action due to volume squeeze. You can turn off bar coloring from settings if you don't want this.
For ease of reading, I've also applied Allenstars Dynamic zones on this indicator so you can easily locate where the reading is entering in long and where it is in sell, this is compared to selected sample size. I've already selected the most common setting for that, so you don't really need to fiddle with it unless you find something better.
This indicator can be used to trade divergences as well, in fact, I feel it is better for that compared to RSI/MACD, the usual suspects.
Past performance is not assurance of future performance and this idea is published for only educational purposes, author taken no responsibility for your profit or loss.
Ruckard TradingLatinoThis strategy tries to mimic TradingLatino strategy.
The current implementation is beta.
Si hablas castellano o espanyol por favor consulta MENSAJE EN CASTELLANO más abajo.
It's aimed at BTCUSDT pair and 4h timeframe.
STRATEGY DEFAULT SETTINGS EXPLANATION
max_bars_back=5000 : This is a random number of bars so that the strategy test lasts for one or two years
calc_on_order_fills=false : To wait for the 4h closing is too much. Try to check if it's worth entering a position after closing one. I finally decided not to recheck if it's worth entering after an order is closed. So it is false.
calc_on_every_tick=false
pyramiding=0 : We only want one entry allowed in the same direction. And we don't want the order to scale by error.
initial_capital=1000 : These are 1000 USDT. By using 1% maximum loss per trade and 7% as a default stop loss by using 1000 USDT at 12000 USDT per BTC price you would entry with around 142 USDT which are converted into: 0.010 BTC . The maximum number of decimal for contracts on this BTCUSDT market is 3 decimals. E.g. the minimum might be: 0.001 BTC . So, this minimal 1000 amount ensures us not to entry with less than 0.001 entries which might have happened when using 100 USDT as an initial capital.
slippage=1 : Binance BTCUSDT mintick is: 0.01. Binance slippage: 0.1 % (Let's assume). TV has an integer slippage. It does not have a percentage based slippage. If we assume a 1000 initial capital, the recommended equity is 142 which at 11996 USDT per BTC price means: 0.011 BTC. The 0.1% slippage of: 0.011 BTC would be: 0.000011 . This is way smaller than the mintick. So our slippage is going to be 1. E.g. 1 (slippage) * 0.01 (mintick)
commission_type=strategy.commission.percent and commission_value=0.1 : According to: binance . com / en / fee / schedule in VIP 0 level both maker and taker fees are: 0.1 %.
BACKGROUND
Jaime Merino is a well known Youtuber focused on crypto trading
His channel TradingLatino
features monday to friday videos where he explains his strategy.
JAIME MERINO STANCE ON BOTS
Jaime Merino stance on bots (taken from memory out of a 2020 June video from him):
'~
You know. They can program you a bot and it might work.
But, there are some special situations that the bot would not be able to handle.
And, I, as a human, I would handle it. And the bot wouldn't do it.
~'
My long term target with this strategy script is add as many
special situations as I can to the script
so that it can match Jaime Merino behaviour even in non normal circumstances.
My alternate target is learn Pine script
and enjoy programming with it.
WARNING
This script might be bigger than other TradingView scripts.
However, please, do not be confused because the current status is beta.
This script has not been tested with real money.
This is NOT an official strategy from Jaime Merino.
This is NOT an official strategy from TradingLatino . net .
HOW IT WORKS
It basically uses ADX slope and LazyBear's Squeeze Momentum Indicator
to make its buy and sell decisions.
Fast paced EMA being bigger than slow paced EMA
(on higher timeframe) advices going long.
Fast paced EMA being smaller than slow paced EMA
(on higher timeframe) advices going short.
It finally add many substrats that TradingLatino uses.
SETTINGS
__ SETTINGS - Basics
____ SETTINGS - Basics - ADX
(ADX) Smoothing {14}
(ADX) DI Length {14}
(ADX) key level {23}
____ SETTINGS - Basics - LazyBear Squeeze Momentum
(SQZMOM) BB Length {20}
(SQZMOM) BB MultFactor {2.0}
(SQZMOM) KC Length {20}
(SQZMOM) KC MultFactor {1.5}
(SQZMOM) Use TrueRange (KC) {True}
____ SETTINGS - Basics - EMAs
(EMAS) EMA10 - Length {10}
(EMAS) EMA10 - Source {close}
(EMAS) EMA55 - Length {55}
(EMAS) EMA55 - Source {close}
____ SETTINGS - Volume Profile
Lowest and highest VPoC from last three days
is used to know if an entry has a support
VPVR of last 100 4h bars
is also taken into account
(VP) Use number of bars (not VP timeframe): Uses 'Number of bars {100}' setting instead of 'Volume Profile timeframe' setting for calculating session VPoC
(VP) Show tick difference from current price {False}: BETA . Might be useful for actions some day.
(VP) Number of bars {100}: If 'Use number of bars (not VP timeframe)' is turned on this setting is used to calculate session VPoC.
(VP) Volume Profile timeframe {1 day}: If 'Use number of bars (not VP timeframe)' is turned off this setting is used to calculate session VPoC.
(VP) Row width multiplier {0.6}: Adjust how the extra Volume Profile bars are shown in the chart.
(VP) Resistances prices number of decimal digits : Round Volume Profile bars label numbers so that they don't have so many decimals.
(VP) Number of bars for bottom VPOC {18}: 18 bars equals 3 days in suggested timeframe of 4 hours. It's used to calculate lowest session VPoC from previous three days. It's also used as a top VPOC for sells.
(VP) Ignore VPOC bottom advice on long {False}: If turned on it ignores bottom VPOC (or top VPOC on sells) when evaluating if a buy entry is worth it.
(VP) Number of bars for VPVR VPOC {100}: Number of bars to calculate the VPVR VPoC. We use 100 as Jaime once used. When the price bounces back to the EMA55 it might just bounce to this VPVR VPoC if its price it's lower than the EMA55 (Sells have inverse algorithm).
____ SETTINGS - ADX Slope
ADX Slope
help us to understand if ADX
has a positive slope, negative slope
or it is rather still.
(ADXSLOPE) ADX cut {23}: If ADX value is greater than this cut (23) then ADX has strength
(ADXSLOPE) ADX minimum steepness entry {45}: ADX slope needs to be 45 degrees to be considered as a positive one.
(ADXSLOPE) ADX minimum steepness exit {45}: ADX slope needs to be -45 degrees to be considered as a negative one.
(ADXSLOPE) ADX steepness periods {3}: In order to avoid false detection the slope is calculated along 3 periods.
____ SETTINGS - Next to EMA55
(NEXTEMA55) EMA10 to EMA55 bounce back percentage {80}: EMA10 might bounce back to EMA55 or maybe to 80% of its complete way to EMA55
(NEXTEMA55) Next to EMA55 percentage {15}: How much next to the EMA55 you need to be to consider it's going to bounce back upwards again.
____ SETTINGS - Stop Loss and Take Profit
You can set a default stop loss or a default take profit.
(STOPTAKE) Stop Loss % {7.0}
(STOPTAKE) Take Profit % {2.0}
____ SETTINGS - Trailing Take Profit
You can customize the default trailing take profit values
(TRAILING) Trailing Take Profit (%) {1.0}: Trailing take profit offset in percentage
(TRAILING) Trailing Take Profit Trigger (%) {2.0}: When 2.0% of benefit is reached then activate the trailing take profit.
____ SETTINGS - MAIN TURN ON/OFF OPTIONS
(EMAS) Ignore advice based on emas {false}.
(EMAS) Ignore advice based on emas (On closing long signal) {False}: Ignore advice based on emas but only when deciding to close a buy entry.
(SQZMOM) Ignore advice based on SQZMOM {false}: Ignores advice based on SQZMOM indicator.
(ADXSLOPE) Ignore advice based on ADX positive slope {false}
(ADXSLOPE) Ignore advice based on ADX cut (23) {true}
(STOPTAKE) Take Profit? {false}: Enables simple Take Profit.
(STOPTAKE) Stop Loss? {True}: Enables simple Stop Loss.
(TRAILING) Enable Trailing Take Profit (%) {True}: Enables Trailing Take Profit.
____ SETTINGS - Strategy mode
(STRAT) Type Strategy: 'Long and Short', 'Long Only' or 'Short Only'. Default: 'Long and Short'.
____ SETTINGS - Risk Management
(RISKM) Risk Management Type: 'Safe', 'Somewhat safe compound' or 'Unsafe compound'. ' Safe ': Calculations are always done with the initial capital (1000) in mind. The maximum losses per trade/day/week/month are taken into account. ' Somewhat safe compound ': Calculations are done with initial capital (1000) or a higher capital if it increases. The maximum losses per trade/day/week/month are taken into account. ' Unsafe compound ': In each order all the current capital is gambled and only the default stop loss per order is taken into account. That means that the maximum losses per trade/day/week/month are not taken into account. Default : 'Somewhat safe compound'.
(RISKM) Maximum loss per trade % {1.0}.
(RISKM) Maximum loss per day % {6.0}.
(RISKM) Maximum loss per week % {8.0}.
(RISKM) Maximum loss per month % {10.0}.
____ SETTINGS - Decimals
(DECIMAL) Maximum number of decimal for contracts {3}: How small (3 decimals means 0.001) an entry position might be in your exchange.
EXTRA 1 - PRICE IS IN RANGE indicator
(PRANGE) Print price is in range {False}: Enable a bottom label that indicates if the price is in range or not.
(PRANGE) Price range periods {5}: How many previous periods are used to calculate the medians
(PRANGE) Price range maximum desviation (%) {0.6} ( > 0 ): Maximum positive desviation for range detection
(PRANGE) Price range minimum desviation (%) {0.6} ( > 0 ): Mininum negative desviation for range detection
EXTRA 2 - SQUEEZE MOMENTUM Desviation indicator
(SQZDIVER) Show degrees {False}: Show degrees of each Squeeze Momentum Divergence lines to the x-axis.
(SQZDIVER) Show desviation labels {False}: Whether to show or not desviation labels for the Squeeze Momentum Divergences.
(SQZDIVER) Show desviation lines {False}: Whether to show or not desviation lines for the Squeeze Momentum Divergences.
EXTRA 3 - VOLUME PROFILE indicator
WARNING: This indicator works not on current bar but on previous bar. So in the worst case it might be VP from 4 hours ago. Don't worry, inside the strategy calculus the correct values are used. It's just that I cannot show the most recent one in the chart.
(VP) Print recent profile {False}: Show Volume Profile indicator
(VP) Avoid label price overlaps {False}: Avoid label prices to overlap on the chart.
EXTRA 4 - ZIGNALY SUPPORT
(ZIG) Zignaly Alert Type {Email}: 'Email', 'Webhook'. ' Email ': Prepare alert_message variable content to be compatible with zignaly expected email content format. ' Webhook ': Prepare alert_message variable content to be compatible with zignaly expected json content format.
EXTRA 5 - DEBUG
(DEBUG) Enable debug on order comments {False}: If set to true it prepares the order message to match the alert_message variable. It makes easier to debug what would have been sent by email or webhook on each of the times an order is triggered.
HOW TO USE THIS STRATEGY
BOT MODE: This is the default setting.
PROPER VOLUME PROFILE VIEWING: Click on this strategy settings. Properties tab. Make sure Recalculate 'each time the order was run' is turned off.
NEWBIE USER: (Check PROPER VOLUME PROFILE VIEWING above!) You might want to turn on the 'Print recent profile {False}' setting. Alternatively you can use my alternate realtime study: 'Resistances and supports based on simplified Volume Profile' but, be aware, it might consume one indicator.
ADVANCED USER 1: Turn on the 'Print price is in range {False}' setting and help us to debug this subindicator. Also help us to figure out how to include this value in the strategy.
ADVANCED USER 2: Turn on the all the (SQZDIVER) settings and help us to figure out how to include this value in the strategy.
ADVANCED USER 3: (Check PROPER VOLUME PROFILE VIEWING above!) Turn on the 'Print recent profile {False}' setting and report any problem with it.
JAIME MERINO: Just use the indicator as it comes by default. It should only show BUY signals, SELL signals and their associated closing signals. From time to time you might want to check 'ADVANCED USER 2' instructions to check that there's actually a divergence. Check also 'ADVANCED USER 1' instructions for your amusement.
EXTRA ADVICE
It's advised that you use this strategy in addition to these two other indicators:
* Squeeze Momentum Indicator
* ADX
so that your chart matches as close as possible to TradingLatino chart.
ZIGNALY INTEGRATION
This strategy supports Zignaly email integration by default. It also supports Zignaly Webhook integration.
ZIGNALY INTEGRATION - Email integration example
What you would write in your alert message:
||{{strategy.order.alert_message}}||key=MYSECRETKEY||
ZIGNALY INTEGRATION - Webhook integration example
What you would write in your alert message:
{ {{strategy.order.alert_message}} , "key" : "MYSECRETKEY" }
CREDITS
I have reused and adapted some code from
'Directional Movement Index + ADX & Keylevel Support' study
which it's from TradingView console user.
I have reused and adapted some code from
'3ema' study
which it's from TradingView hunganhnguyen1193 user.
I have reused and adapted some code from
'Squeeze Momentum Indicator ' study
which it's from TradingView LazyBear user.
I have reused and adapted some code from
'Strategy Tester EMA-SMA-RSI-MACD' study
which it's from TradingView fikira user.
I have reused and adapted some code from
'Support Resistance MTF' study
which it's from TradingView LonesomeTheBlue user.
I have reused and adapted some code from
'TF Segmented Linear Regression' study
which it's from TradingView alexgrover user.
I have reused and adapted some code from
"Poor man's volume profile" study
which it's from TradingView IldarAkhmetgaleev user.
FEEDBACK
Please check the strategy source code for more detailed information
where, among others, I explain all of the substrats
and if they are implemented or not.
Q1. Did I understand wrong any of the Jaime substrats (which I have implemented)?
Q2. The strategy yields quite profit when we should long (EMA10 from 1d timeframe is higher than EMA55 from 1d timeframe.
Why the strategy yields much less profit when we should short (EMA10 from 1d timeframe is lower than EMA55 from 1d timeframe)?
Any idea if you need to do something else rather than just reverse what Jaime does when longing?
FREQUENTLY ASKED QUESTIONS
FAQ1. Why are you giving this strategy for free?
TradingLatino and his fellow enthusiasts taught me this strategy. Now I'm giving back to them.
FAQ2. Seriously! Why are you giving this strategy for free?
I'm confident his strategy might be improved a lot. By keeping it to myself I would avoid other people contributions to improve it.
Now that everyone can contribute this is a win-win.
FAQ3. How can I connect this strategy to my Exchange account?
It seems that you can attach alerts to strategies.
You might want to combine it with a paying account which enable Webhook URLs to work.
I don't know how all of this works right now so I cannot give you advice on it.
You will have to do your own research on this subject. But, be careful. Automating trades, if not done properly,
might end on you automating losses.
FAQ4. I have just found that this strategy by default gives more than 3.97% of 'maximum series of losses'. That's unacceptable according to my risk management policy.
You might want to reduce default stop loss setting from 7% to something like 5% till you are ok with the 'maximum series of losses'.
FAQ5. Where can I learn more about your work on this strategy?
Check the source code. You might find unused strategies. Either because there's not a substantial increases on earnings. Or maybe because they have not been implemented yet.
FAQ6. How much leverage is applied in this strategy?
No leverage.
FAQ7. Any difference with original Jaime Merino strategy?
Most of the times Jaime defines an stop loss at the price entry. That's not the case here. The default stop loss is 7% (but, don't be confused it only means losing 1% of your investment thanks to risk management). There's also a trailing take profit that triggers at 2% profit with a 1% trailing.
FAQ8. Why this strategy return is so small?
The strategy should be improved a lot. And, well, backtesting in this platform is not guaranteed to return theoric results comparable to real-life returns. That's why I'm personally forward testing this strategy to verify it.
MENSAJE EN CASTELLANO
En primer lugar se agradece feedback para mejorar la estrategia.
Si eres un usuario avanzado y quieres colaborar en mejorar el script no dudes en comentar abajo.
Ten en cuenta que aunque toda esta descripción tenga que estar en inglés no es obligatorio que el comentario esté en inglés.
CHISTE - CASTELLANO
¡Pero Jaime!
¡400.000!
¡Tu da mun!

BCeyhan Hull Strategy System by HassonyaHere is the 1 Hour Hull Moving Average Strategy System
1 hour strategy for Day Traders or Swing Traders.
Our purpose in this system, we have a channel belonging to hullma50 - Channel Top and Channel Bottom.
The indicator warns us when the price rises above hullma14 with green arrow.
Then it tells us to be ready when she collides with the lower band.
When hullma14 breaks hullma50 up, we make our first part purchase.
Then hullma14 breaks hullma100 up, we make our second part purchase.
The system warns you with a red arrow when the price drops below the hull moving average of hullma14. If you want, you can sell there.
Then, when the upper band is broken, it warns with caution with the C label.
And finally, when we break down hullma14, hullma 50, we sell parts and we completely exit hullma14, hullma100 down the position we have.
Our strategy is when Hullma50 is below hullma100. If hullma100 is below hullma50, we will buy the first piece when hullma14 breaks hullma100 up. When hullma14 breaks hullma50 up, we will buy a second piece. That's it
Here is the Resistance/Support Breakouts Alerts with green and red arrows
C label is Careful R label is Ready.
and last one, the candle bars were adjusted on a volume based colored bars.
You can find the necessary explanation about the use of bars here.
You can use it in different indicators to support the strategy. (Rsi , Macd , Stochastic ...)
Thanks

Strat-test ALERTSAlerts script, accompanying the "Strategy Tester EMA-SMA-RSI-MACD" script,
when you find a good strategy, you can use the same settings in this Alert script and
you'll have your alerts
Have fun!

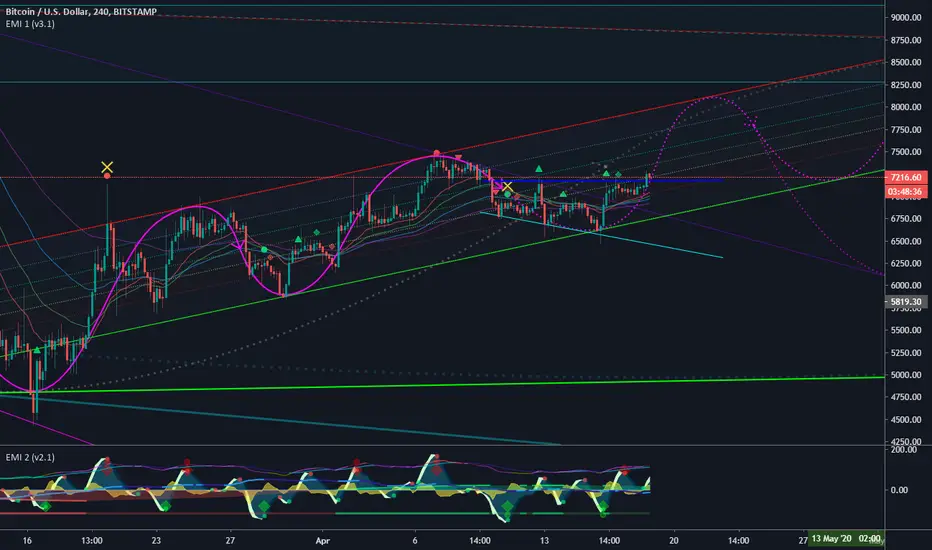
EMI 1 (v3.1)After months and months of back-testing. I finally decided to release this update. Would also like to give out a special thanks to TradingView for making it possible to create scripts and share this with the community. I have acquired a lot of information in this community. I believe that when you take, you should also share. That’s why I am sharing this wonderful indicator for free. Remember, knowledge and experience is the most valuable things in life.
EMI, short for Epic Market Indicator:
60-80% theoretically profitable trades, depending on the time period. However if you use EMI blindly, the percentage might even go lower. Nevertheless, there should be enough presenting opportunities, if you use her wisely. Remember, like any instrument, 'practice makes perfect'.
EMI 1 is actually a combination of diverse indicators:
Tesla EMA/SMA Ribbon: Periods based upon Nikola Tesla's favorite numbers; 3, 6, 9. (Disabled by default)
Fibonacci EMA Ribbon: Periods based upon Fibonacci frequency; 21, 34, 55, 89. (Enabled by default)
Regular EMA/SMA Ribbon: Periods based upon Standard frequency; 10, 20, 100, 200. (Disable by default)
Pivots (Disabled by default).
Bollinger bands (Disabled by default).
Bar trend color (Disabled by default).
Buy & Sell signals, which makes EMI a unique indicator: Based upon diverse indicators & oscillators buy or sell signals. Not predictions, but high probabilities.(Enabled by default, obviously ^^ )
Red symbols are sell or short signals / Green symbols are buy or long signals.
Dots represents possible price action trend reversals and the diamond symbols could be a possible confirmation and the big X is even a stronger confirmation signal. (A top or bottom, not THE bottom or top). These signals are based upon certain buy & sell conditions by a diversity of indicators known by most traders. Think for example, crossing EMA’s, Stochastic RSI , MACD , oversold and overbought territories.
New v3.1:
Modified to even more accurate buy & sell signals
Yellow X
Bar trend colors based on Money Flow Velocity or Money Flow
The signal conditions are based on different oscillators, known by many traders. ALWAYS wait for the candle to close and preferring even more confirmations before taking any consideration nor actions. No signals means most of the time trend continuation. EMI 2 in combination with EMI 1 and traditional authentic pattern formations with a darkened theme is recommended. For more explanation please ask my on streams or join my academy once it's online!
Good luck fellow traders and don't forget to tap the like & follow button. Thanks in advance.
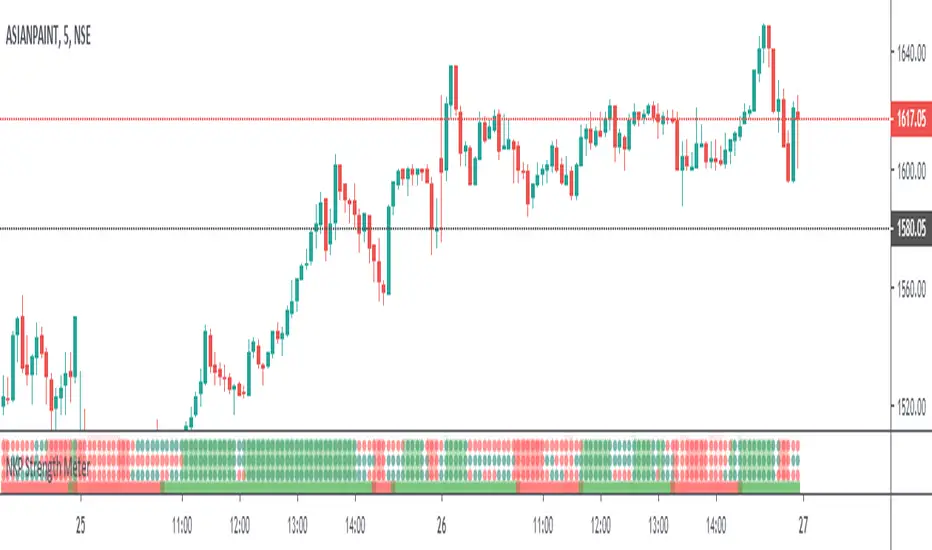
NKP Strength MeterNKP Strength Meter is an indicator it will show the strength of the trend based on built-ins indicators like RSI , MACD , ADX , PSAR and some mathematical formulas. we can apply in any time frame. it is dynamically calculate the values based which time frame user got selected. By using this we can trend strength, read on. ( we can apply this in any time frame chart)
NKP Strength Meter has 3 main components:
one trend bar - it will plot only in two colors either Green or Red. Green indicates buy strength Red indicates sell strength.
three trend dotted lines - these also will plot only in two color either Red or Green. Green indicates buy strength Red indicates sell strength.
color plotted area - if all are in the Green it will plot the green background. all are in red it will plot the red background based these we can easily identify the strength of the trend while seeing the chart.
How does it work?
If all trend bar and dotted lines are green it means buyers strength is more.(continue with uptrend)
If all trend bar and dotted lines are red it means seller strength is more.(continue with downtrend)
mixed colors on dotted line and trend bar there is strength at that time.
What are the signals?
it wont generate any signals. just it will plot the strength dotted lines and trend bar it identify the strength of the trend.
Can we set the Alert on this?
No, it will use to see the strength of the trend while taking the order.(just for trend confirmation)
IMPORTANT: this script does not generate any signals. Perfectly catches long runs in trends at all underlings (stocks, indexes ) at any time frame.
Try it! Good luck and good trading!
For access, please PM us or visit the link below in our Signature.
CuandoCrypto's Swing Trade IndicatorThis indicator combines RSI, MACD, Williams %R and Z-Score to determine if there's a high probability of an imminent trend reversal. This indicator is best used on higher timeframes.
The 1h Wick Wicky - Bitcoin BeatsThis script Uses a bunch of different indicators in order to catch wicks.
Included are:
SAR
JME
Range Filter
ADX
RSI
MACD
Automatic Plotted TP
Unconfirmed entries followed by confirmed entries
This is a combination of different indicators therefore the credit shall not go to me but I have changed certain parameters in order to benefit backtesting profitability.
Trade at your own risk!

Epic Market Indicator 3.0 (EMI 1)After months and months of back-testing, I have finally decided to release this update. I would also like to give out a special thanks to Tradingview for making it possible to create indicators and share this with the community. I have occurred a lot of information in this community. I believe that when you take, you should also share. That’s why I am sharing this wonderful indicator for free. Remember, knowledge and experience is the most valuable things in life.
EMI, Epic Market Indicator:
60-74% theoretically profitable trades, depending on the time period. However if you use EMI blindly, the percentage might even go lower. Nevertheless, there should be enough presenting opportunities, if you use her wisely.
Like in the movie Inception, the deeper and longer you thread into dream within a dream etc., the more dangerous or riskier it becomes. It is recommended to use EMI on 15 min. charts and above. I do not recommend using EMI on altcoin markets.
Tip: People = Psychology > Patterns > Indicators. They are all important nonetheless and explicitly keep this order in the back of your mind when using EMI.
EMI 1 is actually a combination of diverse indicators such as EMA, SMA, Pivots etc. I have turned of certain indicators by default, those I do not need to see most of the time:
- Tesla EMA Ribbon: Periods based upon Nikola Tesla's favorite numbers, 3, 6, 9. (Enabled by default)
- Fibonacci EMA Ribbon: Periods based upon Fibonacci frequency; 13, 21, 55, 89. (Enabled by default)
- Pivots (Disabled by default).
-Bollinger bands (Disabled by default).
- SMA 100 & 200 (Disabled by default).
- Bar trend color: red = bearish & green = bullish (Disabled by default).
-Buy & Sell signals, which makes EMI a unique indicator: Based upon diverse indicators & oscillators. Not predictions, but high probabilities. (Enabled by default, obviously ^^ )
Red symbols are sell or short signals / Green symbols are buy or long signals.
Dots represents possible price action trend reversals and the diamond symbols could be a possible confirmation and the big X is even a stronger confirmation signal. (A top or bottom, not THE bottom or top). These signals are based upon certain buy & sell conditions by a diversity of indicators known by most traders. Think for example, crossing EMA’s, Stochastic RSI, MACD, oversold and overbought territories.
ALWAYS wait for the candle to close and another confirmations before taking any consideration nor actions. No signals means trend continuation.
Using EMI1 in combination with EMI 2, traditional authentic patterns and darkened theme is recommended. Good luck fellow traders and don't forget to smash that like button! Thanks in advance.

BITCOIN_BUYSELL_vs_DOMINANCEUpdated to three lines similar to the 20, 50, 200 ema however they utilize RSI + MACD + EMA + ROC + Averaging powers to generate buy and selling zones

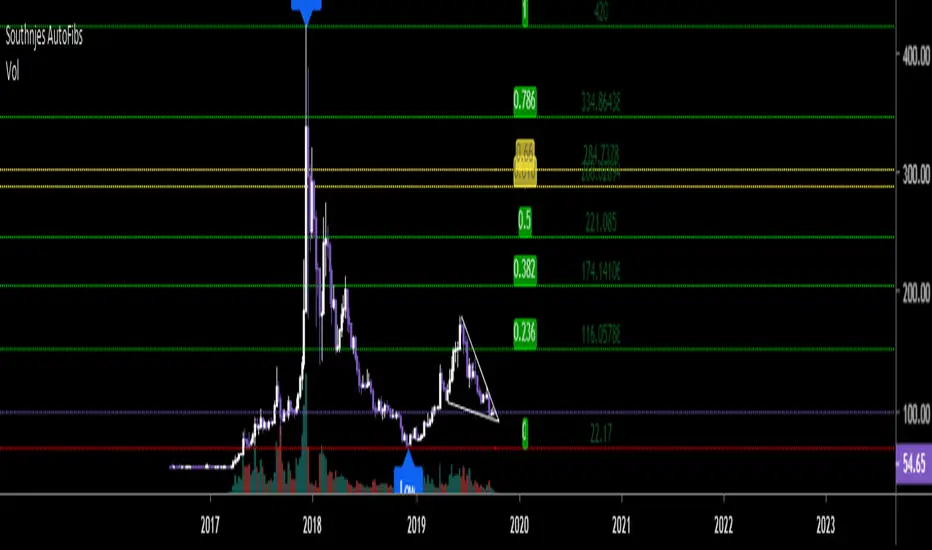
Southnjes - Auto Fibonacci LevelsI obtained this script elsewhere and modified it. Original Script by "borserman". Thank you for this.
I added some extras that he did not have, hence the uploaded and modified version.
I tried to add this to my "Southnjes- Multi 5MA/5EMA crossover signal + RSI/MACD/STOCH Div signal + Bollinger + Candlestick signals." But there were too many outputs so it had to go separate.
Anyway. You can change the "Fib period" to get the positions you need on the levels. Default is 100 but I will change mine to 25/50/200 and sometimes 180 or 220 which gives me my needed highs and lows for calculations. Play with it as it only takes a minute or so to get the desired H/L.
Golden pocket is mapped in golden.
Green is up, Red is down.
Higher Fib levels can be turned off or on (1.272-3.618).
I hope you all enjoy it and again, don't forget to visit borserman for his other great scripts. :)
QuantCat Mom Finder Strategy (1H)QuantCat Momentum Finder Strategy
This strategy is designed to be used on the 1 hour time frame, on all x/btc pairs.
The beautiful thing is it plots the take profit, and stoploss for you for each entry- where I would say use the stoploss for sure and feel with water with how the price action is looking when in profit.
In this strategy, I actually implemented my own trading style into building the strategy. Having to replicate my own trading strategy into an algorithm, I can't make it exactly perfect to how I would trade, but what I can do is try and program the parameters that give it the absolute best chance of making a big move with a small drawdown- which replicates part of my momentum trading style. Here I am using RSI, MACD, EMA and trend filtering values to find moments where there has been a momentum change to play the rest of the move. It only picks the best entries.
There is always a 3-4 R/R move on average with with these trades, meaning 1 in 4 only need to hit to be a break even trader- where most of these strategies have about 35% hit rate.
The stoploss is so crucial to minimise any damage from huge unexpected candles, the strategies can just be used for entries as well, you don't have to stick to the exact formula- of the long and short system, but this by itself is profitable.
The system nets positive results on
-ETH/BTC
-LTC/BTC
-XRP/BTC
-ADA/BTC
-NEO/BTC etc.
We also have a free 15M strategy available too.
You can join our discord server to get live alerts for the strategy as well as speak to our devs! Link in signature below!!!

Helios - by @cryptomrdavis -
Helios is a simple to use oscillator.
It represent the state of different indicators at the moment. If you see a small green column, that means that only one or few indicators are getting into the positiv area, wait for higher bars to get into a trade. Same thing on the red bars side.
Calculation is based on few indicators like RSI , MACD , EMA , SMA and some more.
Happy trading
+++ use this tool on your own risk. i'm not responsible for your loses +++
Show some ❤
____________________________________________________________________________
BTC: 1GVRDK3HHr9CKM5SF2CGpCNXFuavB3L4j9
ETH: 0x7b825fa752b9926D3E8397cDb1d9E5473D074646
XMR: 41zL2SQS7zyZmwXKng2TeUWsMi5vMmkgSdDCjULUTvM6ichwm1E2ZDEYGt56zk9ghoM9bekhjycSwa8amtTcB2JiUet5jtg
NEO: AXja5xPDhczfm2ujHyBfpkQAAnMsXsazmb
ZEC: zcZzFkRx95cp7MtuW8wLhC5zz5RYF9QkT2uPPmhZZHc6ppXepHGgCSeAS1rtD6WFdqsM5p1gZm2gfirnrnviucsdP4aCpqU
XLM: GAXUQJSW55C7MAC4GI26NZUGIKSHFDVFRFKZCXPLMPY4HCADSDT55XK6
WAVES: 3PCMkNpMHxSraTCkwV1ENcBKa9sXbVCGjQX
BCH: qz57n04ud6mn42u00aymqkku8tfh0lk4jv9c28mjvv
____________________________________________________________________________
++++ cryptotradingresource.com ++++
____________________________________________________________________________

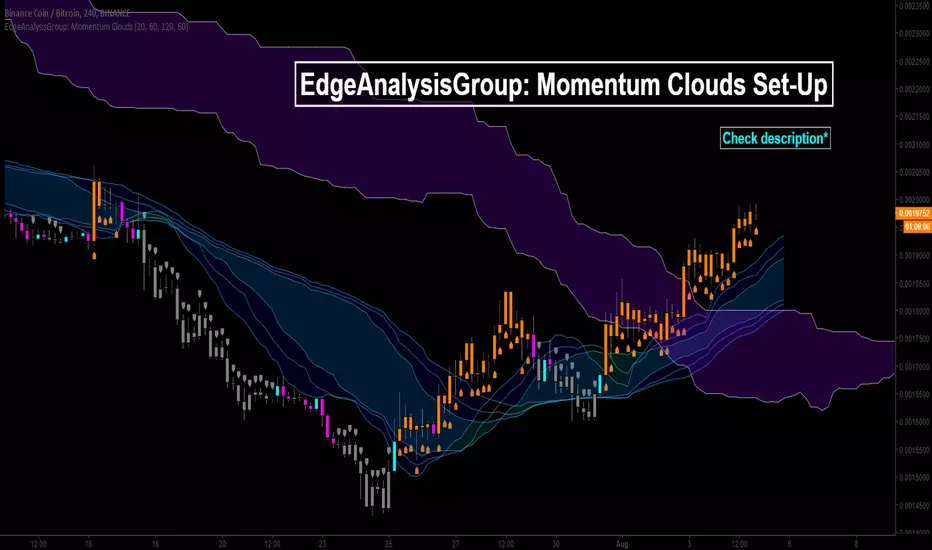
EdgeAnalysisGroup: Momentum Clouds Set-UpWhat do you need turned off and on in the settings to have this exact setup?
Bar colours transparency = 100%
Lagging Span off
Baseline off
Conversion line off
What is it?
This trading strategy is an all in one. This means any additional parameters could make the set-up very noisy. I spent hours developing and back-testing the core of the whole method- volume clouds. The volume cloud is the wavey/much more fluid centralised cloud. These have in essence been left the same with new additions crafted around the volume clouds, the ichi and the momentum indicator. It Uses-
Volume
MA's
Ichimoku Clouds
Displacement
RSI
MACD
Even though your fundamental price action will come into play when using this indicator- it does abstract resistance/support zones and trade zones very nicely to make the overall difficulty of the indicator and trading experience much lesser.
How to trade on it?
Trade edge to edge on the clouds.
Mid-section is safe trade area on volume cloud.
Trade re-tests / rejections. Watching for 3rd retest + for break back into cloud.
Bullish mom + break above vol cloud = Bullish trend.
Bearish mom + break below vol cloud = Bearish trend.
Stoploss is situational.
Example board:
BTC/USD 1 Day.
ETH/BTC 1 Day.
NEO/BTC 4 Hour.
Hopefully from these examples, when observing them you are understanding how the clouds work, and how the momentum ties into the whole model, any questions don't hesistant to comment- and feel free to drop me a follow for my hard work too.
Thank you for reading, I hope this indicator can aid you, as it is doing with a few of my friends and myself.
All information found here, including any ideas, opinions, scripts, views, predictions, forecasts, commentaries, suggestions, or stock/cryptocurrency picks, expressed or implied herein, are for informational, entertainment or educational purposes only and should not be construed as personal investment advice. These are not facts but my personal views and opinions.
I will not and cannot be held liable for any actions you take as a result of anything you read here.